What Do Graphs Do for Us in the Business World?
The business world deals with lots of data that needs to be presented to the target audience. According to the research done in 2019, graphs in business has a major impact in delivering data to enable the respective audience to comprehend the intended message.
It has been revealed that graphs do not get the credit they receive despite their contribution within the business sector. Most business owners joke, thinking that graphs are simple visuals that do not portray any meaningful message to the public.
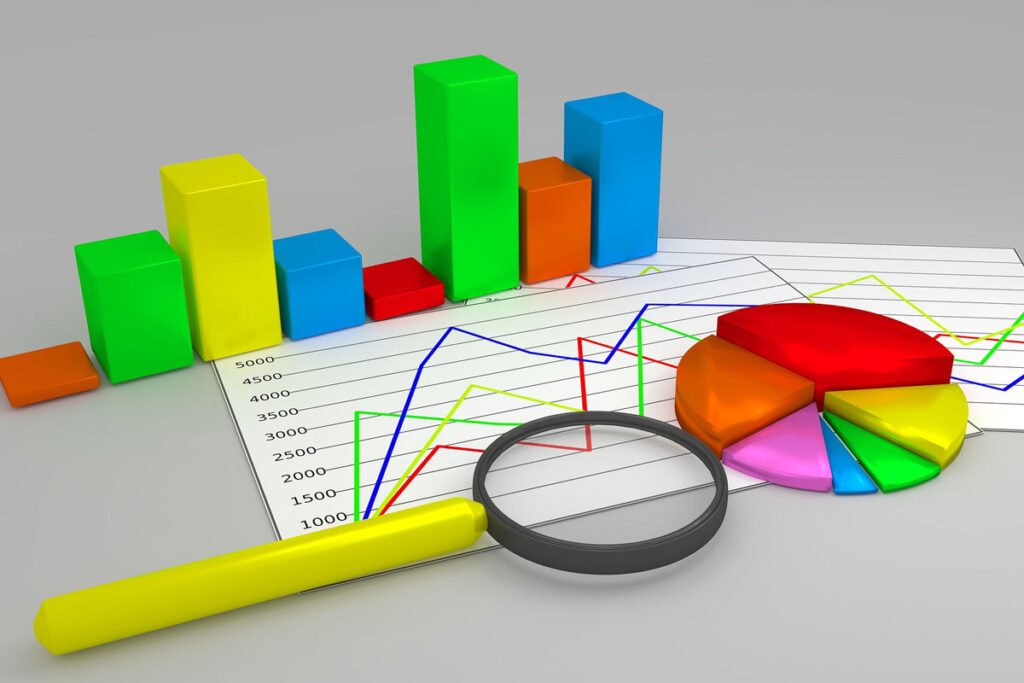
What are graphs? Graphs refer to visual presentations that are used to deliver different sets of results or patterns to make the presentation better. The most important thing is that they improve cognitive reasoning and the scope of the data.
The use of graphs in business has dramatically advanced following their impact on data delivery in different aspects. However, many business owners still get it complex to understand how data visualization through graphs makes everything possible. Let’s sink deep into details!
The Impact of Graphs in the Business Industry

Business management is a vast area within the business niche that many business owners struggle to make things work. The concept of graphs and visualization aids in making business management an easy thing to execute and place your business brand on the right track.
In addition, graphical analysis is an essential aspect within the business management sector, especially in presenting crucial information depending on the business requirements. It helps in reporting and targeting specific elements within the business industry through data visualization and evaluation of specific data points.
It might be challenging to understand how a mere diagram can achieve all this. The reality is that visual patterns are powerful, especially in evaluating different aspects to deliver insightful decisions that impact the constant growth and development of a business.
Graphs like Sankey graph, Pareto chart, survey chart and Google Sheets Combo Chart represent data in a logical format using different dimensions depending on the kind of statistics being represented. The ultimate goal of using graphs in business is to showcase the relationship between various aspects to eliminate chances of recording losses within the business.
Note that any type of information presented using a graph has a specific relationship that links them together. By comparing different aspects, you can easily learn more about the direction of the business. Also, you will identify whether you are making profits or not.
Graphs have greatly revolutionized so that you can create them within the shortest time possible. In addition, graphs can be used to present more information regarding a single variable that can be later compared to other aspects to come up with a uniform decision.
However, the type of graph you choose to present information on depends on the kind of data you have in hand. Also, the depth of information to be presented affects your choice when acquiring a graph type. You can use a pie chart to present information that incorporates relative quantities in different divisions.
This means that understanding the purpose of presenting is very important since it affects your final decision. When you want to identify the patterns of particular goods that were sold within a specified time frame, you can use a line graph to learn more about specific patterns.
How Graphs Make the Business World Better
Many people wonder about the impact of graphs on the betterment of the business industry. The reality remains that graphs greatly impact the business sector, especially when dealing with different sets of data regarding various operations across the industry.
Assuming that there were no graphs, it could be difficult for prospects and customers to understand the meaning of data due to the complex nature of specific data points. By presenting data that correspond to different companies within the industry, it makes it easier to make decisions that impact the growth of the business.
Note that a single graph can present detailed information in the form of a story. It gives users the freedom to set various success targets that trigger the general growth of the business. Besides, presenting a detailed piece of content to the public is a daunting process, especially when done manually.
However, graphs have made everything possible by delivering information in a visually appealing manner. The good thing is that prospects and customers can easily comprehend the information and take the necessary action.
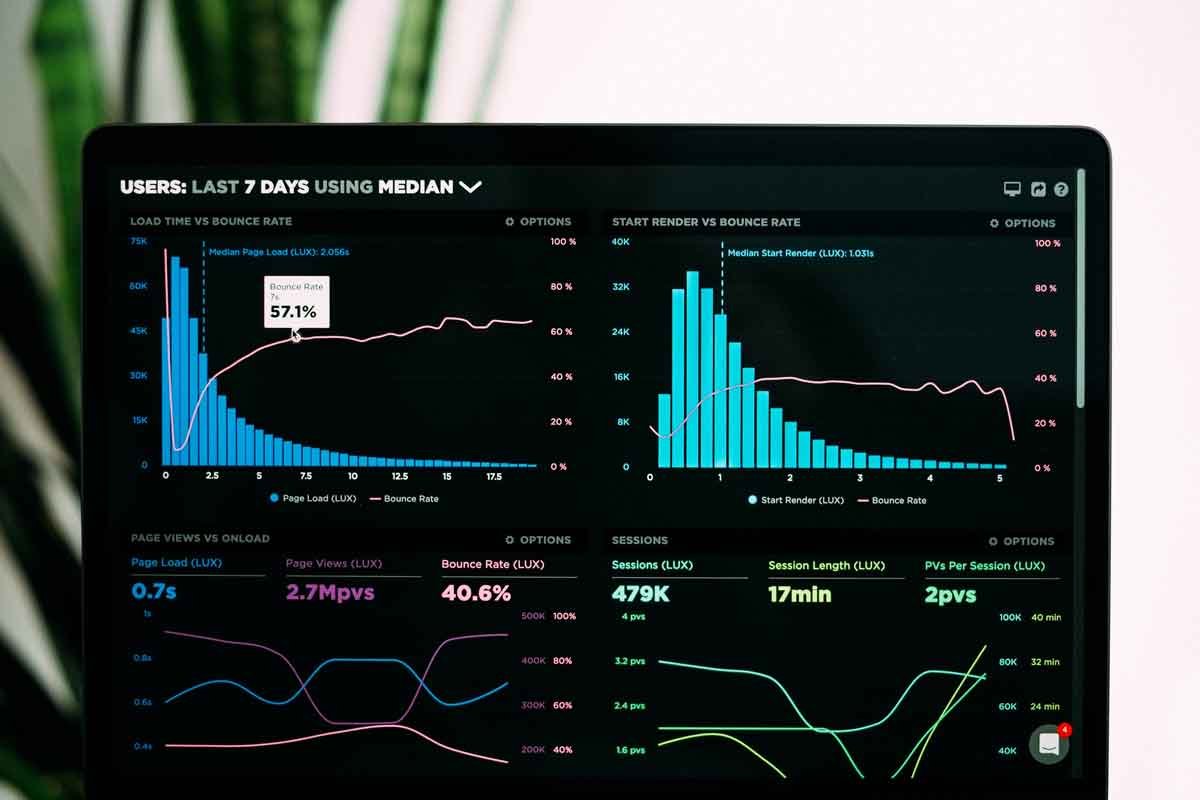
By properly using graphs, business owners can easily understand trends, patterns, and outliers using data. A graph helps users understand every aspect found behind every figure within your business operations. Proper use of the figures and numbers impacts the decision-making process.
Best Type of Graphs in Business
1 Column Chart
A bar chart uses vertical bars to showcase comparisons within different categories across the business environment. Remember that anything that can be counted can also be displayed using a column chart. The ultimate goal of column charts is to channel attention to total numbers instead of trends.
2 Scatter Plot
A Scatter plot is a fantastic type of graph commonly used in business operations to showcase statistical data. It mainly showcases the relationship between a couple of variables. The main agenda is to identify how much one variable affects the other one.
3 Pyramid Graph
A Pyramid graph is an exciting type of graph that is visually appealing in nature. It comes in the shape of a Pyramid or a triangle. When you intend to showcase some form of hierarchy in your business data set, this is the best type of graph to use. This is due to the progressive nature of how this graph type operates.
4 Line Graph
This is among the most popular types of graphs mainly used in the presentation of statistics and business data. In most cases, a line graph is used to present values of something within a specified schedule. It’s a good choice when presenting data trends and displaying trends in multiple categories.
Conclusion
The application of graphs in business operations began in 1923. This was when entrepreneurs introduced graphs in the industry to evaluate different sets of data to develop actionable insights that enhance the general growth of businesses.


