
The number one reason for a customer to turn to another brand is poor customer service. Still, only 1 in 26 customers will let you know when they have a negative experience with your brand, while the others will simply leave. In modern companies, customer service no longer plays a supporting role but has become one of the crucial factors to influence a company’s bottom line, along with the other two customer-facing units – sales and marketing.
Still, to be able to set your customer service standards, you need to know how to measure your metrics and KPIs to understand your customer satisfaction and use this data to improve your service, where needed. You can get data for some of these metrics from your own team, while for the other ones, you’ll have to reach out to your customers. Here are some basic customer service metrics and KPIs you should track.
First contact resolution (FCR)
This metric refers to the percentage of customer issues that were solved in the first interaction with a client, no matter which channel was used – a phone call, an email or a live chat. FCCR is easy to track and measure, as all you need to do is divide the number of problems resolved during the first contact, with the total number of issues. As these metrics are directly correlated with customer satisfaction, the higher the rates are, the better your service is. You can also use it to determine your product’s weak points, and plan how to best resolve them.
Average first response time (AFRT)
It’s not just whether you’ve successfully solved their issues that influence the satisfaction of your users, but also how quickly you’ve responded to their first query. Statistics show that 66% of customers consider that valuing their time is the most important thing a company can do to provide them with a great customer experience.
When a customer approaches you with an issue, they want your agent to reply as soon as possible, and within the acceptable time frame for each industry and a particular channel. Less than an hour for social media channels, a day for the queries made via email, or within 3 minutes if the query was made by the phone.
You can calculate this rate when you subtract the time of the customer’s request from the time of the first response and then use those numbers to calculate the average score over the desired time period.
Customer satisfaction (CSAT)

Still, by measuring the average first response time, you won’t get an idea of how satisfied your users were with the response they got. To get the complete picture, you’ll need to measure the satisfaction of your customers using a feedback survey, with answers ranging from 1 to 5, or from extremely dissatisfied to extremely satisfied with the service you provided. You should evaluate customer satisfaction after every interaction with your agents so that you would be able to determine whether you’re using reliable contact centre solutions.
Calculate user satisfaction by taking into account only “satisfied” and “very satisfied” feedback, versus the total number of survey responders. You can compare your scores with the averages in your industry to see how you stack up against your competitors.
Customer effort score (CES)
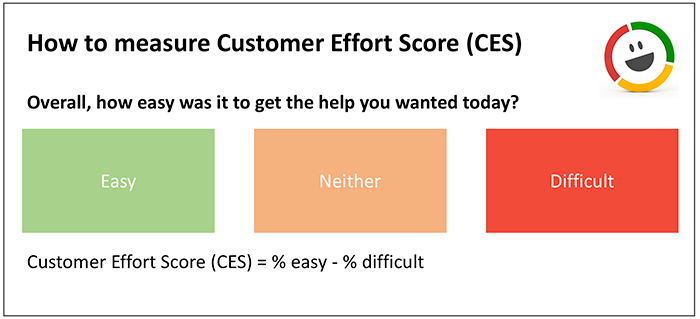
Customers are more loyal to brands they can easily do business with, and that will provide them support to solve their issues effortlessly. CES measures how easy it was for your customers to get adequate feedback and is usually measured on the Likert scale, with answers ranging from 1 to 7, from strongly agree to strongly disagree, and then the average of all scores is calculated.
Net promoter score (NPS)
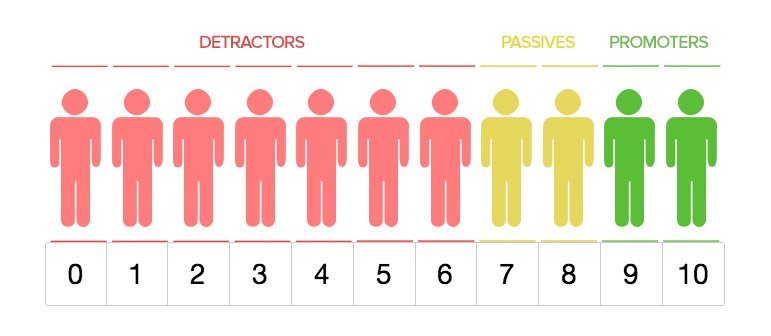
You’ll find out how your customers feel about your brand if you ask them how likely they are to recommend it to their friends or colleagues, on a scale from 1 to 10. You’ll use the scores to divide your customers into three groups:
- Detractors. Those are the ones who gave you a 0-6 rating, and who can have a negative impact on customer satisfaction.
- Passives. Customers who scored you 7 or 8 will fall into this category, and you’ll leave them out of the calculation as they are neither emotionally engaged nor disengaged with your brand.
- Promoters. Among the group of those who gave you a rating of 9 or 10, you’ll find your most loyal customers that you can count on to get word of mouth going and give you recommendations.
You can calculate your NPS by subtracting the percentage of detractors from the percentage of promoters, and aim for the higher scores, meaning greater customer satisfaction. If you find out that you have more detractors than promoters, you are facing a great risk of customer churn, so you need to assess the underlying issues and try to solve them.
By keeping track of these basic customer service metrics, and analyzing them, you can determine your strengths and weaknesses, and decide on certain actions to achieve concrete benefits, and fulfil your company goals.
